
Lift and Gain Tables
The lift and gain table is a useful tool for measuring the value of a predictive model. Lift and gain values are especially useful when decision trees are being used to target (prioritize) marketing efforts. Here is an example of a Lift and Gain table:
Tree  Class %     Cum %      Cum %     Cum     % of       % of
Node  of bin   Population  of class   Gain  Population   Class   Lift
-----  -------  ----------  --------  -----  ----------  ------  -----
    5   75.00     23.19      41.38    1.78     23.19     41.38   1.78
    7   68.75     27.83      48.97    1.76      4.64      7.59   1.64
   58   66.67     35.65      61.38    1.72      7.83     12.41   1.59
   77   65.71     45.80      77.24    1.69     10.14     15.86   1.56
   76   29.41     55.65      84.14    1.51      9.86      6.90   0.70
   59   21.43     59.71      86.21    1.44      4.06      2.07   0.51
    6   18.18     72.46      91.72    1.27     12.75      5.52   0.43
   57   14.71     82.32      95.17    1.16      9.86      3.45   0.35
   42   11.48    100.00     100.00    1.00     17.68      4.83   0.27
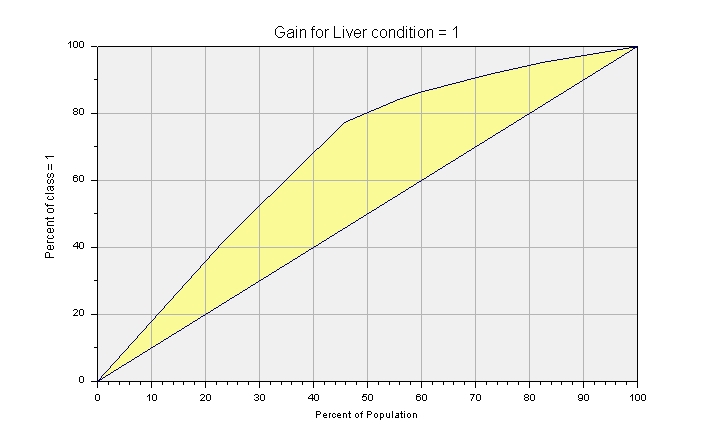
Here is an example of a gain chart generated by DTREG:
To understand lift and gain, consider the example of a company that wants to do a mail marketing campaign. The company has a database of 100,000 potential customers, and they calculate that each mailed advertisement will cost $1.00. Prior experience has shown that the average response rate is 10%. So if they send the advertisement to all of the prospects, they will incur an expense of $100,000 and they will likely receive approximately 10,000 sales.
Hoping to improve their return on investment (ROI), the company uses DTREG to build a predictive model using data from previous campaigns with Sale/No-sale as the target variable and various demographic variables as predictors. The predictive model is used to prioritize the prospects so that they can be sorted in decreasing order of expected sales.
Using the "Cum % Population", "Cum % of class", "Cum Gain" and "Lift" columns from the Lift/Gain chart, the marketing director of the company prepares the following table:
| Ads Mailed | Cum. % Class | Expected Sales | Cum. Gain | Lift |
| 10000 | 30.00 | 3000 | 3.00 | 3.00 |
| 20000 | 50.00 | 5000 | 2.50 | 2.00 |
| 30000 | 65.00 | 6500 | 2.17 | 1.50 |
| 40000 | 72.00 | 7200 | 1.80 | 0.70 |
| 50000 | 80.00 | 8000 | 1.60 | 0.80 |
| 60000 | 85.00 | 8500 | 1.42 | 0.50 |
| 70000 | 90.00 | 9000 | 1.29 | 0.50 |
| 80000 | 95.00 | 9500 | 1.19 | 0.50 |
| 90000 | 98.00 | 9800 | 1.09 | 0.30 |
| 100000 | 100.00 | 10000 | 1.00 | 0.20 |
The table divides the total prospect set into 10 bins with the best 10% of the prospects in the first bin, the second-best 10% in the second bin, and so forth. The table has five columns:
- Ads mailed- This is the cumulative number of ads mailed starting with the best prospects and advancing to less well qualified prospects.
- Cum. % class- This is the cumulative percentage of the scales expected from ads sent to prospects in the bins up to and including the one with the percentage. For example, we expect to receive 50% of total sales from ads sent to the prospects in the two highest-priority bins.
- Expected sales- This is the total number of sales that can be expected from the cumulative number of ads mailed. If no model was used, the expected sales would always be 10% of the ads mailed. With the model, we see that expected sales are considerably better for the best prospects. The cumulative expected sales for a bin are calculated by multiplying the total expected sales (10,000) by the cumulative percent of class figure.
- Cum. Gain- This is the ratio of the expected sales using the model to prioritize the prospects divided by the expected sales if a random mailing was done.
- Lift - This is the ratio of the expected sales for the prospects in a bin divided by the expected sales for the prospects in the same bin using random mailing.