Linear Discriminant Analysis
Linear Discriminant Analysis (LDA)
Introduction to Discriminant Analysis
Originally developed in 1936 by R.A. Fisher, Discriminant Analysis is a classic method of classification that has stood the test of time. Discriminant analysis often produces models whose accuracy approaches (and occasionally exceeds) more complex modern methods.
Discriminant analysis can be used only for classification (i.e., with a categorical target variable), not for regression. The target variable may have two or more categories.
To explain discriminant analysis, let's consider a classification involving two target categories and two predictor variables. The following figure by Balakrishnama and Ganapathiraju shows a plot of the two categories with the two predictors on orthogonal axes:
A visual inspection shows that category 1 objects (open circles) tend to have larger values of the predictor on the Y axis and smaller values on the X axis. However, there is overlap between the target categories on both axes, so we can't perform an accurate classification using only one of the predictors.
Linear discriminant analysis finds a linear transformation ("discriminant function") of the two predictors, X and Y, that yields a new set of transformed values that provides a more accurate discrimination than either predictor alone:
TransformedTarget = C1*X + C2*Y
The following figure (also from Balakrishnama and Ganapathiraju) shows the partitioning done using the transformation function:
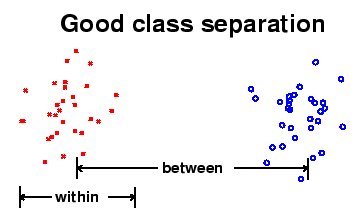
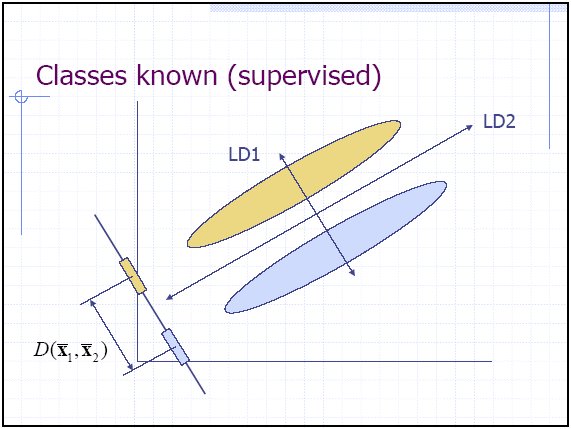
A transformation function is found that maximizes the ratio of between-class variance to within-class variance as illustrated by this figure produced by Ludwig Schwardt and Johan du Preez:
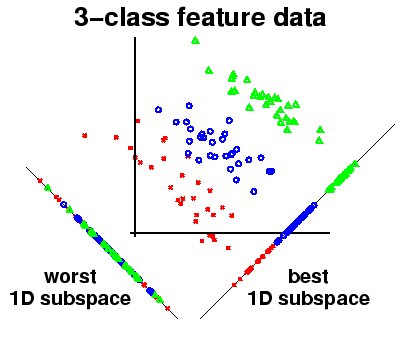
The transformation seeks to rotate the axes so that when the categories are projected on the new axes, the differences between the groups are maximized. The following figure (also by Schwardt and du Preez) shows two rotates axes. Projection to the lower right axis achieves the maximum separation between the categories; projection to the lower left axis yields the worst separation.
The following figure by Randy Julian of Lilly Labs illustrates a distribution projected on a transformed axis. Note that the projected values produce complete separation on the transformed axis, whereas there is overlap on both the original X and Y axes.
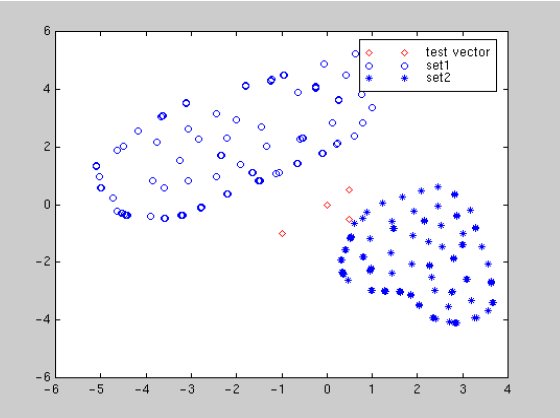
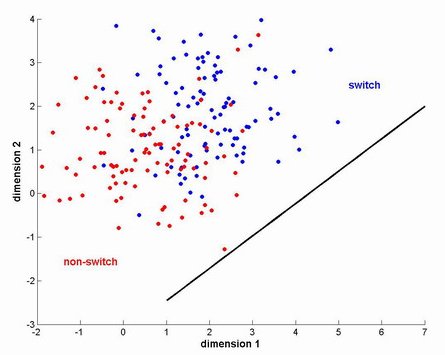
In the ideal case, a projection can be found that completely separates the categories (such as shown above). However, in most cases there is no transformation that provides complete separation, so the goal is to find the transformation that minimizes the overlap of the transformed distributions. The following figure by Alex Park and Christine Fry illustrates a distribution of two categories ("switch" in blue and "non-switch" in red). The black line shows the optimal axis found by linear discriminant analysis that maximizes the separation between the groups when they are projected on the line.
The following figure (also by Alex Park and Christine Fry) shows the distribution of the switch and non-switch categories as projected on the transformed axis (i.e., the black line shown in the figure above):
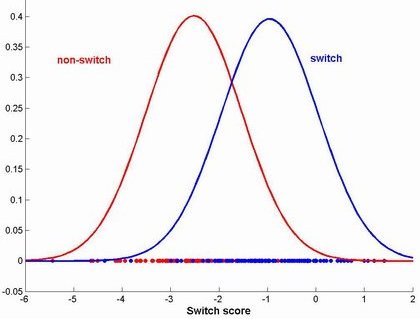
Note that even after the transformation there is overlap between the categories, but setting a cutoff point around -1.7 on the transformed axis yields a reasonable classification of the categories.
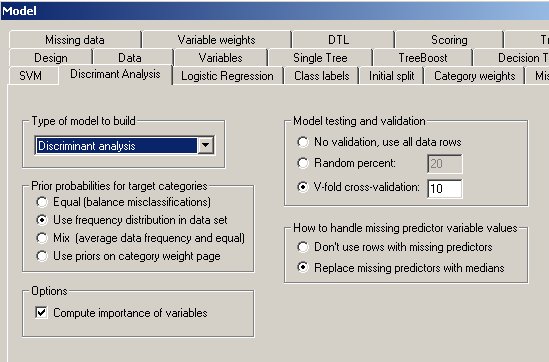
The DTREG Discriminant Analysis Property Page
Controls for discriminant analyses are provided on a screen in DTREG that has the following image: