
TreeBoost - Stochastic Gradient Boosting
TreeBoost - Stochastic Gradient Boosting
"Boosting" is a technique for improving the accuracy of a predictive function by applying the function repeatedly in a series and combining the output of each function with weighting so that the total error of the prediction is minimized. In many cases, the predictive accuracy of such a series greatly exceeds the accuracy of the base function used alone.
The TreeBoost algorithm used by DTREG is optimized for improving the accuracy of models built on decision trees. Research has shown that models built using TreeBoost are among the most accurate of any known modeling technique.
The TreeBoost algorithm is functionally similar to Decision Tree Forests because it creates a tree ensemble, and it uses randomization during the tree creations. However, a random forest builds the trees in parallel and they "vote" on the prediction; whereas TreeBoost creates a series of trees, and the prediction receives incremental improvement by each tree in the series.
Mathematically, a TreeBoost model can be described as:
PredictedTarget = F0 + B1*T1(X) + B2*T2(X) + … + BM*TM(X)
Where F0 is the starting value for the series (the median target value for a regression model), X is a vector of “pseudo-residual” values remaining at this point in the series, T1(X), T2(X) are trees fitted to the pseudo-residuals and B1, B2, etc. are coefficients of the tree node predicted values that are computed by the TreeBoost algorithm.
Graphically, a TreeBoost model can be represented like this:
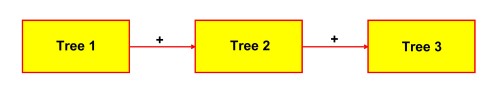
The first tree is fitted to the data. The residuals (error values) from the first tree are then fed into the second tree which attempts to reduce the error. This process is repeated through a chain of successive trees. The final predicted value is formed by adding the weighted contribution of each tree.
Usually, the individual trees are fairly small (typically 3 levels deep with 8 terminal nodes), but the full TreeBoost additive series may consist of hundreds of these small trees.
Here are some of the features of TreeBoost:
- TreeBoost models often have a degree of accuracy that cannot be obtained using a large, single-tree model. TreeBoost models are often equal to or superior to any other predictive functions including neural networks.
- TreeBoost models have been shown to produce more accurate results than competing composite-tree methods such as bagging or boosting using other methods such as AdaBoost.
- TreeBoost models are as easy to create as single-tree models. By simply setting a control button, you can direct DTREG to create a single-tree model or a TreeBoost model for the same analysis.
- TreeBoost models can handle hundreds or thousands of potential predictor variables.
- Irrelevant predictor variables are identified automatically and do not affect the predictive model.
- TreeBoost uses the Huber M-regression loss function (Huber, 1964) which makes it highly resistant to outliers and misclassified cases.
- TreeBoost procedures are invariant under all (strictly) monotone transformations of the predictor variables. So transformations such as (a*x+b), log(x) or exp(x) do not affect the model. Hence, there is no need for input transformations.
- The sophisticated and accurate method of surrogate splitters is used for handling missing predictor values.
- The stochastic (randomization) element in the TreeBoost algorithm makes it highly resistant to over fitting.
- Cross-validation and random-row-sampling methods can be used to evaluate the generalization of a TreeBoost model and guard against over fitting.
- TreeBoost can be applied to regression models and k-class classification problems.
- TreeBoost can handle both continuous and categorical predictor and target variables. Variables with textual values like “Male” and “Female” can be used as well as numeric variables.
- TreeBoost models are grown quickly – in some cases up to 100 times as fast as neural networks.
- The TreeBoost algorithm achieves the accuracy of other boosting methods such as AdaBoost with much lower sensitivity to misclassified cases and outliers.
TreeBoost Property Page
When you select the TreeBoost property page, you will see a screen like this:
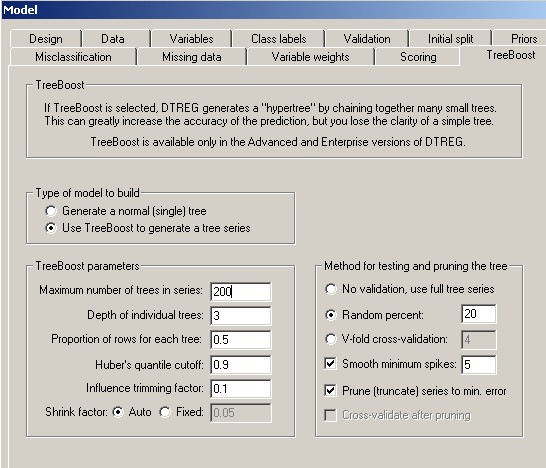
Type of model to build: Select whether you want DTREG to create a single-tree model or a TreeBoost model consisting of a series of trees. If you select a single-tree model, all of the other controls on this screen will be disabled.
Maximum number of trees in series: Specify how many trees you want DTREG to generate in the TreeBoost series. If you select the appropriate options in the right panel, DTREG will prune (truncate) a series to the optimal size after building it. You can click Charts on the main menu followed by Model Size to view a chart that shows how the error rates vary with the number of trees in the series.
Depth of individual trees: Specify how many levels (splits) each tree in the TreeBoost chain should have. The number of terminal nodes in a tree is equal to 2k where k is the number of levels. So, for example, a tree with a depth of 1 has two terminal nodes, a tree with a depth of 2 has 4 terminal nodes, and a tree with a depth of 3 has 8 terminal nodes. Because many trees contribute to the model generated by TreeBoost, it is not necessary for individual trees to be very large. Experiments have shown that trees with 4 to 8 terminal nodes (depths of 2 to 3) work well. The depth should be at least as large as the number of variable interactions. If the predictions from a TreeBoost model are not as accurate as those from the corresponding single-tree model, try increasing the depth of the TreeBoost trees.
Proportion of rows in each tree: Research has shown (Friedman, 1999b) that TreeBoost generates the most accurate models with minimum over fitting if only a portion of the data rows are used to build each tree in the series. Specify for this parameter the proportion of rows that are to be used to build each tree in the series; a value of 0.5 is recommended (i.e., half of the rows). The specified proportion of the rows are chosen randomly from the full set of rows. (This is the stochastic part of stochastic gradient boosting.)
Huber’s quantile cutoff: The TreeBoost algorithm uses Huber’s M-regression loss function to evaluate error measurements (Huber, 1964). This loss function is a hybrid of ordinary least-squares (OLS) and least absolute deviation (LAD). For residuals less than a cutoff point, the squared error values are used. For residuals greater than the cutoff point, absolute values are used. The virtue of this method is that small to medium residuals receive the traditional least-squares treatment, but large residuals (which may be anomalous cases, mismeasurements or incorrectly coded values) do not excessively perturb the function. After the residuals are calculated, they are sorted by absolute value and the ones below the specified quantile cutoff point are then squared while those in the quantile above the cutoff point are used as absolute values. The recommended value is 0.9 which causes the smaller 90% of the residuals to be squared and the most extreme 10% to be used as absolute values.
Influence trimming factor: This parameter is strictly for speed optimization; in most cases it has little or no effect on the final TreeBoost model. When building a TreeBoost model, the residual values from the existing tree series are used as the input data for the next tree in the series. As the series grows, the existing model may do an excellent job of fitting many of the data rows, and the new trees being constructed are only dealing with the unusual cases. “Influence trimming” allows DTREG to exclude from the next tree build process rows whose residual values are very small. The default parameter setting of 0.1 excludes rows whose total residual represent only 10% of the total residual weight. In some case, a small minority of the rows represent most of the residual weight, so most of the rows can be excluded from the next tree build. Influence trimming is only used when building classification models.
Shrinkage factor: Research has shown (Friedman, 2001) that the predictive accuracy of a TreeBoost series can be improved by apply a weighting coefficient that is less than 1 (0 < v < 1) to each tree as the series is constructed. This coefficient is called the “shrinkage factor”. The effect is to retard the learning rate of the series, so the series has to be longer to compensate for the shrinkage, but its accuracy is better. Tests have shown that small shrinkage factors in the range of 0.1 yield dramatic improvements over TreeBoost series built with no shrinkage (v = 1). The tradeoff in using a small shrinkage factor is that the TreeBoost series is longer and the computational time increases.
If “Auto” shrinkage factor is selected, the shrinkage factor is calculated by DTREG based on the number of data rows in the training data set.
Let NumRows = the number of data rows in the training data set.
Then, ShrinkFactor = max(0.01, 0.1 * min(1.0, NumRows/10000))
If you prefer, you can select the “Fixed” option and specify a shrinkage factor.
Pruning Methods for TreeBoost Series
TreeBoost series are less prone to problems with overfitting than single-tree models, but they can benefit from validation and pruning to the optimal size to minimize the error on a test dataset. In the case of a TreeBoost series, “pruning” consists of truncating the series to the optimal number of trees (the individual trees in the series are not pruned).
No validation, use full tree series: All of the data rows are used to “train” the TreeBoost series. No validation or pruning is performed.
Random percent of rows: If you check this button, DTREG will hold back from the model building process the specified percent of the data rows. The rows are selected randomly from the full dataset, but they are chosen so as to stratify the values of the target variable. Once the model is built, the rows that were held back are run through the tree and the misclassification rate is reported. If you enable tree pruning, the tree will be pruned to the size that optimizes the fit to the random test rows. The advantage of this method over V-fold cross-validation is speed – only one TreeBoost series has to be created rather than (V+1) tree series that are required for V-fold cross-validation. The disadvantage is that the random rows that are held back do not contribute to the model as it is constructed, so the model may be an inferior representation of the training data. Generally, V-fold cross-validation is the recommended method for small to medium size data sets where computation time is not significant, and random-holdback validation can be used for large datasets where the time required to build (V+1) tree series would be excessive.
V-Fold cross-validation: If you check this button, DTREG will use V-fold cross-validation to determine the statistically optimal size for the TreeBoost series. You may specify how many “folds” (cross-validation trees) are to be used for the validation; a value in the range 3 to 10 is recommended. Specifying a larger value increases the computation time and rarely results in a more optimal tree. For a detailed description of V-fold cross validation, please see page 92.
Smooth minimum spikes If you check this button, DTREG will smooth out fluctuations in the error rate for various size models by averaging the misclassification rates for neighboring tree series sizes Sometimes the error rate fluctuates as the tree size increases, and an anomalous minimum “spike” may occur in a region where the surrounding error rates are much higher. This happens more often when using random-row-holdback validation than when using V-fold cross-validation which tends to average out error rate values. If you enable smoothing of minimum spikes, DTREG averages each error-rate/tree-size value with its neighboring values. The effect is to cause DTREG to seek regions where the minimum values are consistently low rather than isolated low values. The generated TreeBoost series may be longer, but they usually are more stable when used for scoring. The value associated with this button specifies how many values are to be averaged for smoothing. For example, a smoothing value of 3 causes DTREG to compute the average of three points – the center point and the neighboring points on the left and right.
Prune (truncate) series to minimum error: If this box is checked, DTREG will truncate the TreeBoost series at the length that has the minimum validation error as determined by the validation method selected above. If this box is not checked, then DTREG will use the validation method to measure the error rate, but the full series will be retained.
Cross validate after pruning: If this box is checked and V-fold cross validation is selected, DTREG will recomputed the cross-validated error rate after pruning the series so that the validation error accurately reflects the truncated series. This doubles the time required for cross validation. If this box is not checked, the error rate for the full, un-truncated TreeBoost chain is used for validation statistics.